Jul
22
Written by:
Michael Washington
7/22/2011 5:55 AM

So you have deployed your LightSwitch application and everything is running fine. Then you get an email that a user is unable to perform a function. The problem you now have is that this is a problem that you can only see in production. When you need to preform debugging of a LightSwitch application in production, you want to use Tracing.

Getting the Most Out of the Save Pipeline in Visual Studio LightSwitch by Dan Seefeldt (http://www.code-magazine.com/articleprint.aspx?quickid=1103071), is the article you want to start with. It specifically talks about Tracing at the end of the article, however the entire article explains the “structure of how LightSwitch works” and that is important to understand what the data means that you discover when performing a Trace.
You can also read more about Tracing at this link: http://msdn.microsoft.com/en-us/library/wwh16c6c.aspx.
This article covers Tracing when your LightSwitch application is deployed as a “web application”.
Set-up Tracing Of Your Deployed Applications
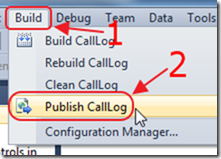
Publish your LightSwitch application.
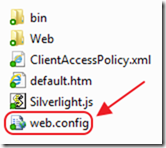
Open the web.config of your deployed application.
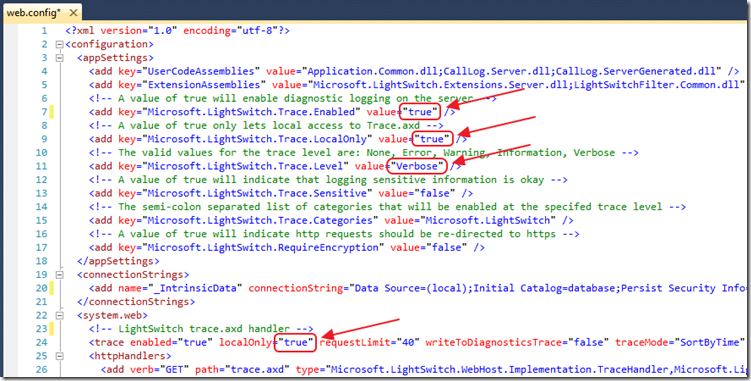
To enable Tracing, the Microsoft.LightSwitch.Trace.Enabled setting, and the trace enabled setting, must be set to true.
In this example, we will also set Microsoft.LightSwitch.Trace.LocalOnly to true (so Tracing will only work using ”http://localhost”), and Microsoft.LightSwitch.Trace.Level to verbose (so we will see more detailed information).
See the Dan Seefeldt article for an explanation of all the settings.
View Tracing In Your Web Browser
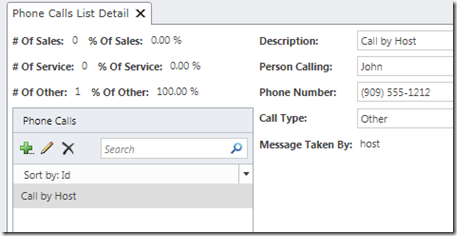
First open a web browser and navigate to your LightSwitch application.
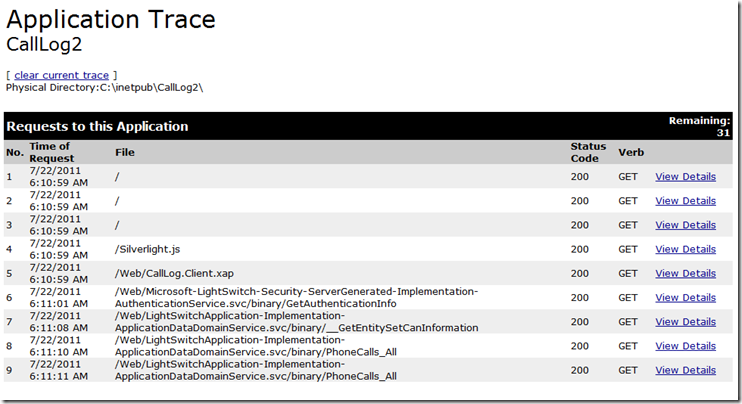
Next, open another web browser, and go to the web address with ”/Trace.axd” at the end (for example: http://localhost/{Your LightSwitch Application}/Trace.axd).
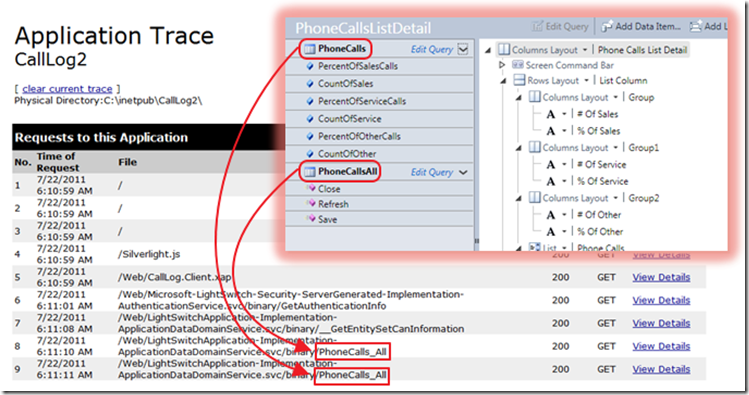
If we look at the the screen that we have navigated to inside the LightSwitch screen designer, we can see that the collections on the left-hand side of the screen are called and show up in the Trace.
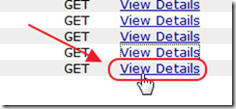
When we click View Details…
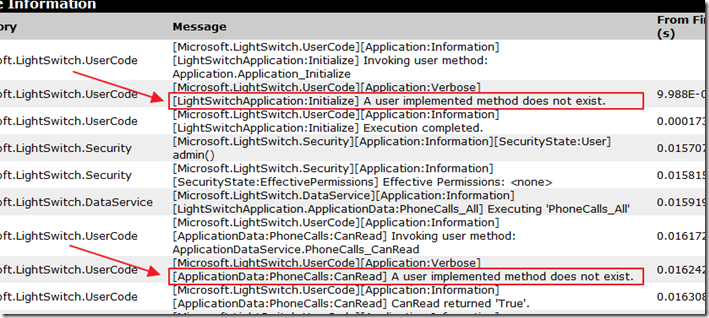
We will see some lines marked “A user implemented method does not exist”.
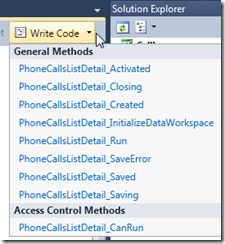
This refers to the the methods that are part of the “Save Pipeline” that you could have implemented code in but you did not.
Special Thanks
A special thanks to LightSwitch team member, Dan Seefeldt, for his assistance in creating this article.
7 comment(s) so far...
**** WHEN YOU ARE DONE TRACING REMEMBER TO TURN IT OFF ****
:)
By Michael Washington on
7/22/2011 11:02 AM
|
Hi, this is great! I used the tracking method you talked about (I'm new to LS), and helped me find out the reason why I had those crazy red 'X's after deployement. I found it was actually my wrong setting in ConnectionString, and didn't set up the Other Connectons at all (I know, stupid me). Now it works perfectly. Thanks a lot, and I read quite a few of your other post. You rock!
Fang
By Fang on
8/25/2011 2:18 PM
|
i configure my ls app as follow
but when i click [view details ] link , i didn't
get detailed information as you posted
my application runs ok on localhost in debug environment , but when publish to virtual folder on local host , still get this Red X
knowing that i connect to local sql sever DB by windows auth
any help ,
omar awwad
By omar awwad on
10/11/2011 4:23 AM
|
what about iis 6 , is there any difference in the configuration , it seems its fine on iis7 , but with iis6 on windows xp , i get red x , and can not get the details from trace.axd
By omar awwad on
10/11/2011 4:23 AM
|
omar awwad - Yes IIS6 may be different because I wrote the article using IIS7. Perhaps this will help:
http://blogs.msdn.com/b/lightswitch/archive/2011/09/20/diagnosing-problems-in-a-deployed-lightswitch-application-eric-erhardt.aspx
By Michael Washington on
10/11/2011 4:24 AM
|
So I see the entries in the Trace Information that tell me that "A user implemented method does not exist". I see that these are methods that I could have implemented, but did not. I don't understand what that's telling me about the error condition. If I didn't implement a partial method, why would lightswitch be looking for it and why would it cause an error?
Thanks.
By Seth Wilpan on
3/19/2013 12:06 PM
|
@Seth Wilpan - You will want to direct any specific questions to the Microsoft forums: http://social.msdn.microsoft.com/Forums/en-US/lightswitch/threads
By Michael Washington on
3/19/2013 12:07 PM
|